Raspberries and blackberries are known as caneberries, a family of delicate berries in the Rubus family that grow on tough but thin woody canes and thrive in cool, moist climates. The term “bramble” is also used when referring to caneberries. Loganberries, black raspberries and Boysenberries are also in the caneberry family.
Research has shown that caneberries are very high in polyphenols and contain antioxidants that contribute to overall health and may help reduce the incidence of cancers, heart disease and age related cognitive decline.
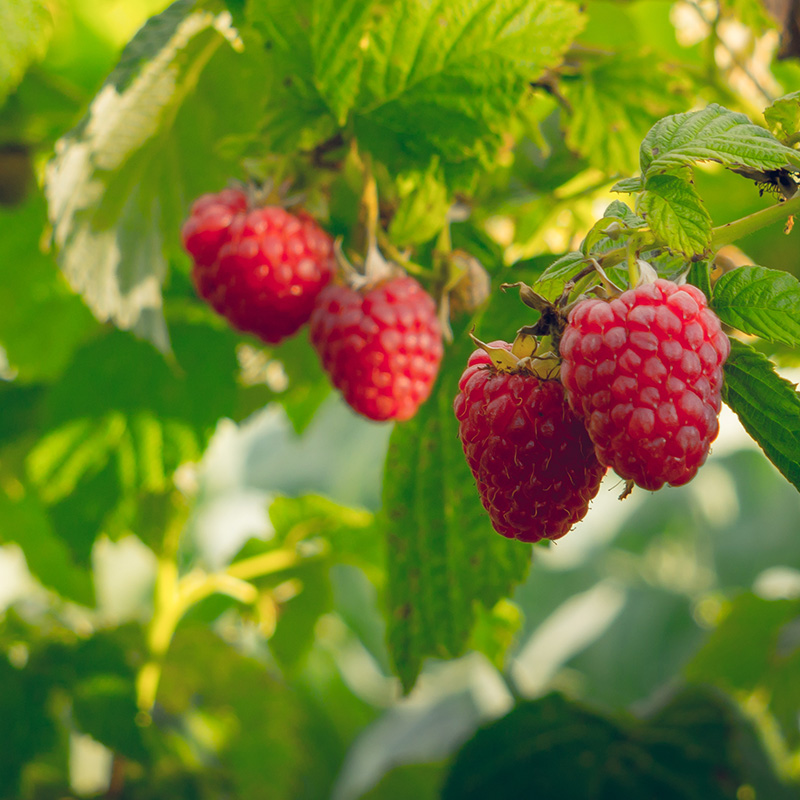
Learn what varieties and methods for growing raspberries and blackberries in your home garden do best in your area — many are suited to specific climates and regions.
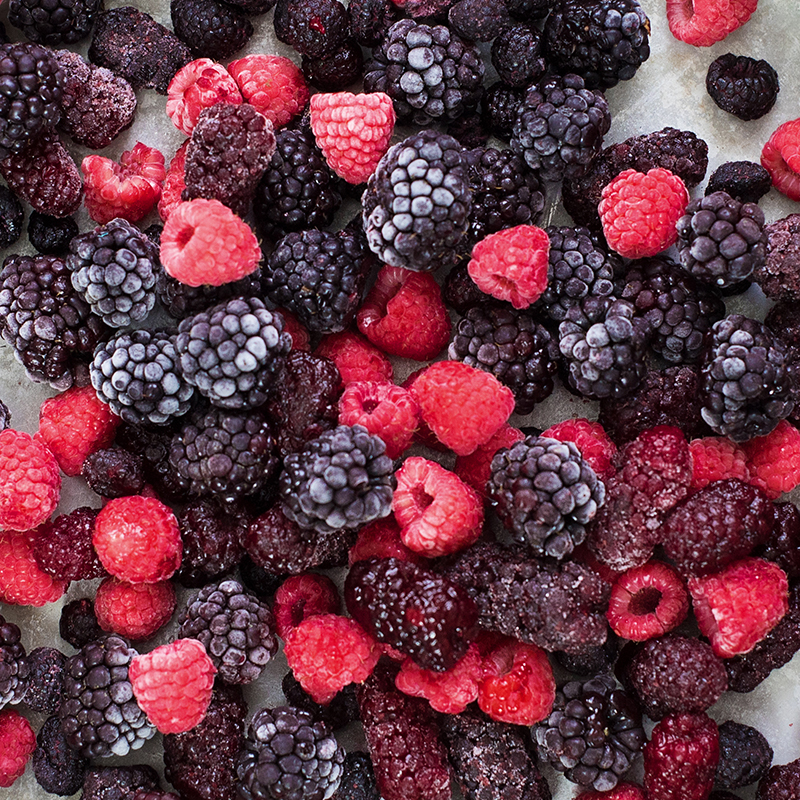
Learn the best tips and tricks for freezing raspberries and blackberries. Freezing berries keeps them fresh and let’s you enjoy that fresh-picked summer flavor all year long!
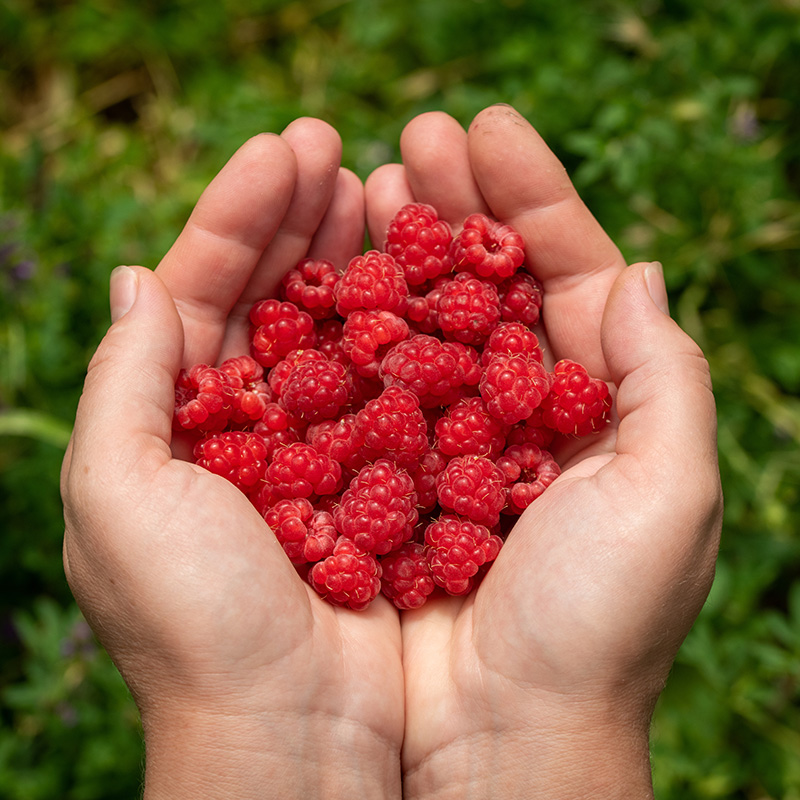
Look for berries that are slightly soft, plump, and deep in color. Raspberries are ripe when they slip off the stem and into your hand without resistance.
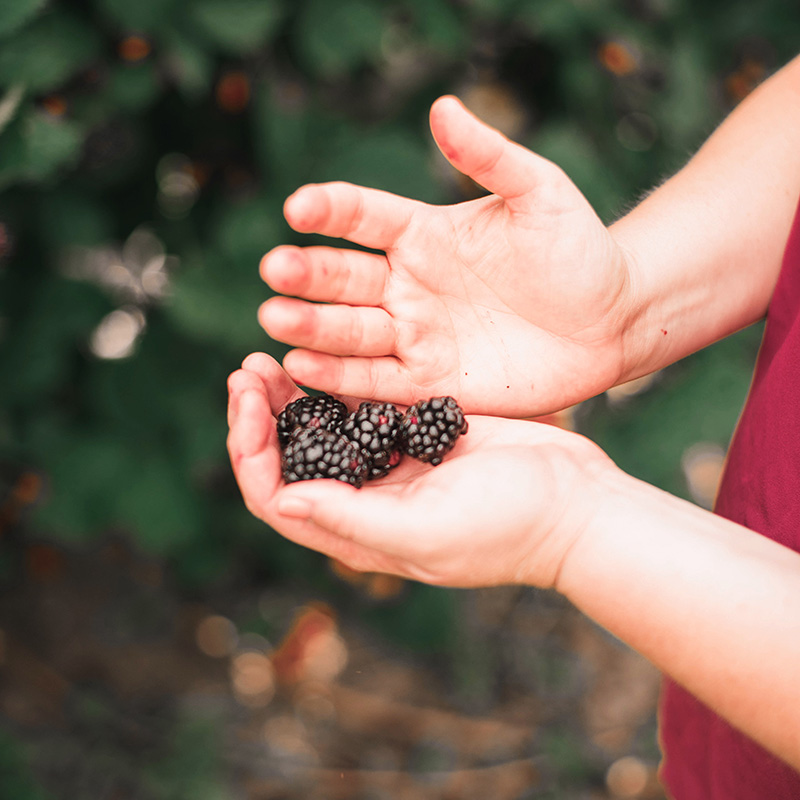
A ripe blackberry is deep black with a plump, full, and slightly tender feel. If the berry is red or purple, it’s not ripe yet. A ripe blackberry will pull free from the plant with only a slight tug.